Big Trains
It really is different this time, because just like all the other times, it’s the innovators who run world businesses.
Company: Baldwin locomotive
Product: A train

Baldwin Locomotive Works was the largest manufacturer of steam locomotives on the planet. The biggest locomotives, with 6,300 horsepower, were still manufactured in the US in 1944, yet the very last steam loco was made just 12 years later, and the company was shut in 1972, bankrupted by new technology.
Baldwin was started in 1831, long before the railroad builders had pushed through to the Pacific west. It was originally based in Philadelphia, and grew to be the largest manufacturer of steam locomotives, eventually making over 70,000 engines before it shut.
At the time that Baldwin was still only planning its giant locos, a new company was being registered in Delaware in 1934, registered by one William E Boeing. Just one single engine on a modern day Boeing 777 puts out 110,000 horse power, equivalent to 17 of the 4-8-8-4 steam engines under each wing.

Company: Rolls Royce
Product: A jet engine

Moving on up in horsepower, the top ticket actually goes to the French these days, who have built a turbine engine rated at 2.34 million horsepower. (It produces electricity in a nuclear power plant).
Engine manufacturers…the same but clearly different.
The box below shows the US tech revolution, their earnings every 10 seconds
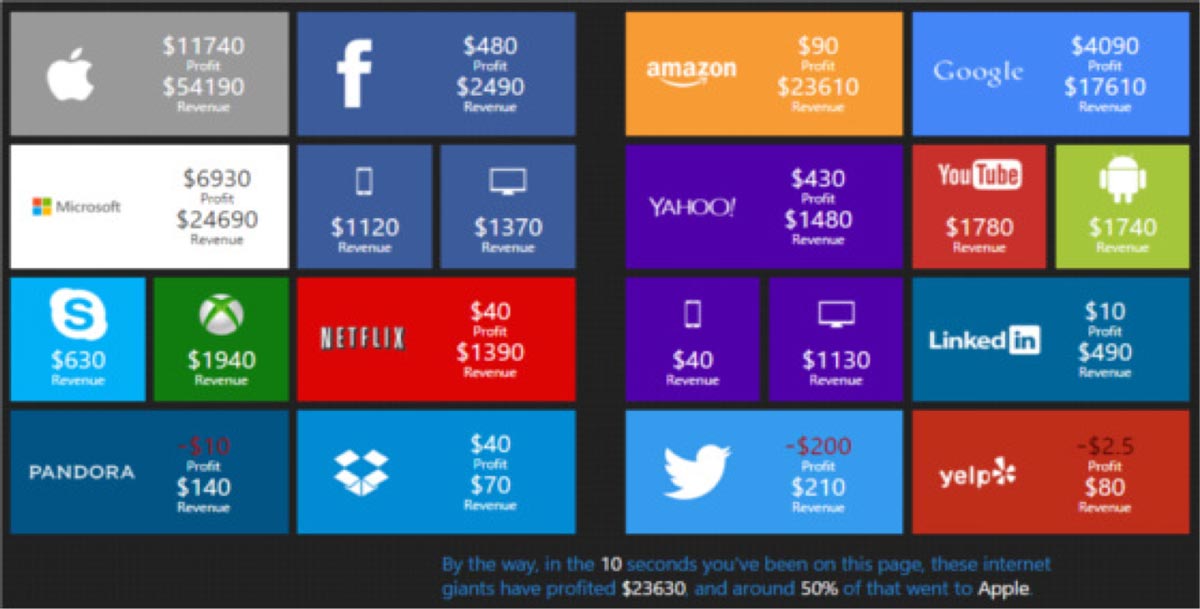
The figures are impressive, and represent very simply how the ‘business’ part of world economics has changed. No longer does the Dow Jones boast of Bethlehem Steel and the railroad companies that started the index, but that does not mean that global business has imploded. It has evolved.
Another way of looking at it is that the $430bn cash pile is a higher value, in cash, than the market worth of our 7 largest companies. The value of that cash is not a figment of a flash trader's algorithm, or a hedge fund's short trades, or an investment bank's leveraged deal, it is cash in the bank.
It's probably in the wrong place though, as the global books would be more balanced with the money in the central banks, but the money is there, and it happens to be owned by the shareholders, including you and me.
Google, Facebook, Microsoft and Apple are all bigger than Exxon Mobil, Apple has $215bn in cash, Google has $65bn, Microsoft $90bn. The 5 tech firms at the top of the tree have enough cash in the bank to buy the 7 largest companies in the FTSE, including Shell, HSBC, GSK and Vodafone. In cash.
Currently impressive as they are, tech companies only represent three of the top fifty positions in terms of global revenue, those being Verizon at #42 and HP at #48, trailing the mighty Apple at #12. At that position, Apple has more revenue than the world’s largest car manufacturer, Toyota.
As a thought, try thinking of how you would describe in one sentence, to a Martian, what Apple makes. Toyota makes cars.
- If you could only choose one, could you exist easier without a Toyota for a day, or without an Apple?
- Now consider that question in relation to giving up the product for a whole year?
- Now consider which company you would prefer to bet on still being in the Global Top 50 when your children retire?
Let me introduce James Bond to this note on the markets, to further illustrate the shift in the spent £. Released in November last year, the film took $70m in its first weekend. Have you heard of Fallout 4? No? Me neither, but it is an online video game that launched four days after Spectre and in its first twenty four hours generated revenue of $750 million. (Call of Duty I have heard of, but its 24 hour record is a lightweight at only $550m). Fallout 4 made in 24 hours what it takes Halfords plc 161 days to generate – the cost/profit differential is obvious. Do you know the name of the company that owns Fallout 4?

Market falls – who’s to blame?
- China – last December it altered a technical part of its currency exchange, effectively creating a devaluation. It is the guesswork behind the rumours behind the reasons for that move that upset institutional investors.
- US of A – the Fed raised the interest rate, not by much, but officially notifying everyone that the beginning of the end of cheap money has already passed.
- Saudi Arabia – opening the oil taps collapsed the price of oil: banks have had to write off loans, the biggest oil companies were big parts of the stock markets and have now fallen, giant sovereign wealth funds fed by oil have now had to offload assets, oil assets have been swapped for cash causing bank & corporate liquidity problems, high frequency trading gorges itself on market volatility creating more market volatility et al.
Where now?
The economic picture is the simple part – growth, but fairly weak. China might be slowing down but the predicted 5% growth is still growth, and it is equal to the UK’s all time, once only, high of 5% in q1, 1974. Don’t forget that the US essentially only sells one product to China – food – and the Chinese are simply going to eat more this year than they did last year, through population growth and the food-share of its enlarged GDP expenditure.
- The average price of a barrel of oil throughout 2011, 2012 and 2013 was over $100, and in 2014 it was circa $75. The median price in 2015 was $50. According to the US Energy Information website, global consumption last year was 93.78 million barrels per day – if the price has fallen (say) $50, then the fuel bill of the planet has fallen by $1.7 trillion – where’s all that money?
- Who is better off now with the lower fuel costs? This is a table of who has saved how much, but remember such global figures are notoriously difficult to pin down – the output does prove the point though, that there is a huge amount of cash in manufacturers’ pockets, and that the Middle East and Russia are being severely hurt. Russia loses $2bn in revenue for every $1 fall in the oil price, so let’s say it’s lost a round $100bn of foreign currency income. Not a happy Putin.

China consumed circa 11.5 million barrels of oil per day last year: given an average price fall of $50 from 2013, its energy costs have therefore fallen by $184 billion – that’s a lot of extra cash to benefit Chinese businesses. China has been producing 1.4bn barrels per year from its own resources; this output leaves them importing 4.2bn barrels per year, at a $40 lower cost saving $168bn – still a huge sum. Further, Nomura estimate that China’s oil output has now peaked and its shortfall from here will soak up every barrel produced by Iran. This isn’t a secret, this is published to all the market players. [peakoilbarrel.com]
Given that Planet Earth has effectively had a $1.7trn tax cut since 2013, or had $1.7trn more cash left in its pockets, why are the UK’s companies worth 15% less now than they were in Dec 2013? We can understand the fall in the value of oil companies and miners, but food retailers, supermarkets and phone companies? What else could be driving down the markets?
Is the value wrong?
The price-to-earnings ratio (p/e) is the common figure used to determine if the market is cheap or expensive (though the flaw is that it is today’s price / yesterday’s income). The long term average figure is around 15. The p/e preceding the 2008 crash was also 15, so that’s no clue, suggesting its actually individual sectors that are being down valued. FTSE p/e is projected at 14.56x for 2016, and 12.47x for 2017. Average.
- Cherchez la Ferrari – it is always wise to look at who’s making money – there’s nothing an investment bank likes more than market volatility. There is money being made on all the stocks being traded on the way down, then back up, and if it’s clients’ portfolios losing value, not the banks’, then where’s the harm they might say?
- Our in-house analyst, Jim, spoke with an employee of Deutsche Bank yesterday – apparently it is worth 25% less today than it was 12 days ago. He, like us, doesn’t believe there has been a fundamental collapse in its business – the price fall is simply a reflection of this formula: ‘[sentiment + media] x traders + [hedge funds]’. If Efficient Market Theory is true then one of either the 27 Jan share price was wrong, or today’s price – take your pick.
I don’t have any evidence to validate this comment, but I’m pretty sure Unilever will sell more toothbrushes in Indonesia this year, irrespective of stock market behaviour, and that Colgate-Palmolive will sell more toothpaste in India, helping pay its continuing dividends. The number of newly licensed drivers in China is growing at 12% pa – the small engine car sales in China rose a year-on-year 15.4% in December. Plus ça change….
Returning full circle, it’s the innovators who converted transport from canal barges to trains, busting the canal companies, then to planes busting passenger train and ship companies. BT ‘owned’ the entire UK telephone system, and now it plays second fiddle to Vodafone.
Market behaviour changes human behaviour
It is never anything other than depressing to see the value of an investment fall, and it can also be unnerving, however it is very important for people to distance themselves from emotional reactions, and to focus on the prudent logic. That’s easily said by me as a trite comment, a bit like reassuring a nervous passenger on a very lumpy flight – it might be fine, but it sure feels very disconcerting all the same.
- An investor will lose money on the FTSE this month in only two scenarios: 1) if the investor sells the investment at this year’s lower prices, or 2) if constituent members of the index actually go bankrupt. Note that Shell is the largest member at 7.6% of the index, and HSBC is next at 7.33%.
- If, for example, HSBC were to go bankrupt, the remaining 92.67% of the FTSE would have to grow by less than 7.9% for an investor to lose money in the year – and remember that the current cash dividend paid is circa 4%, so you’d only need another 4% capital growth to deal with the loss of our second largest company, with its assets of over $2.6 trillion.
- The point being that almost all investors only lose money in market troughs because they choose to sell at the bottom, not because the investments fail.
If you were born in 1969 or earlier, then you have lived as an adult through a 2 day 22% fall in 1987, and the 31% fall of 2008, the worst ever one year fall. And you’ve seen the markets drive straight back up the other side, to even higher levels. It’s what markets do.
What do the big ‘name’ investors do, the darlings of the investment media?
Last time we looked (which is frequently) Neil Woodford was 98% invested in equities, and Terry Smith was slightly more cautious at only 96%. Warren Buffett? With Berkshire Hathaway’s $60bn in cash and $23bn in net annual income the market falls are simply a cut price discount spree for his shopping habits – he buys when other are selling, and that strategy would appear to work.
What isn’t different this time is what that investment heuristic refers to…..the markets are not going to flat line, and they are not going one way only. They will go up and down, we just don’t know the timescales – because if we did, the financial world would simply stop.