One step forward, and one step back
Charles Ellis’ seminal tome ‘Winning the Losers’ Game’ explains in much more interesting detail than we could write about how we our investments have fared over the second half of this year, if you’d like a copy then please drop me an email.
- The UK has its feet stuck in the gloopy, sticky morass that is Brexit, and that has a direct impact on our currency, on the predictions of investors over what will happen, inward investment into the UK and simply investor confidence.
- The US has a gung ho businessman at the helm whose expertise lies in creating annual profit-figures (not necessarily profit-cash), who has always seen government and taxation as unnecessary interferences in the making of corporate money.
The markets provide their valuations on both these scenarios – if you’ve been reading current commentary on ‘record valuations’, ‘sky high prices’ etc., then here’s why, and here’s what has actually being going on:
The Dow Jones is a group of only 30 companies ranging from ExxonMobil to Disney to Apple to General Electric. GE has been in the index since 1907, Apple since 2015, very different businesses, flourishing in very different parts of the economic cycle.
- Apple has a cash pile of $268bn but a potentially fragile model (remember Nokia, Ericsson, Sony mobile), GE has debt of $134bn.
- Apple’s cash flow for 2017 is $63bn, GE’s is $7bn
This demonstrates just how disparate the constituents are and why the embedded risk is material. Much as the Dow can continue to climb, GE was formed in 1892 and if it were to pop then $154bn of shareholder value would disappear and there would be a panic in the US markets.
Temporarily
One could argue that it is nonsensical to have two completely different businesses within the same index, and that Apple should toddle off back to the NASDAQ (it’s got a dual listing) – it’s up 55% this year whilst GE is down 43%, this is a market index that has euphoria in some areas and big selling pressure on others, but the weight of money behind the popular stories is just so immense that it moves the entire index upwards.
Temporarily TINA
Economic and market cycles are called that because they don’t flat line – if the market fell and didn’t move then there would be no risk, and we’d end up calling it cash (which has no risk and is the same £1 tomorrow as it was yesterday). The position currently is even more cyclical because of TINA – There’s No Alternative (not my abbreviation). QE meant the governments were/are buying bonds – because of that the prices of the bonds have gone through the roof and can only now fall, or stagnate at best – so when the majors do sell down their equities where will they put the proceeds?
That’s a very real dilemma for those investors because most of them – as professional money managers – are simply not allowed to hold material sums of cash. They don’t want to go into bonds because the capital prices are too near a cliff edge and the yields for, say, 10 yr. gilts are just 1.2%. The Dow as an index has a yield of 2.26%, so the investment argument is to sit and collect the income whilst waiting for the capital value to deliver what is needed – i.e. ignore the share price volatility because if you sell out you’re not actually removing the risk to your capital.
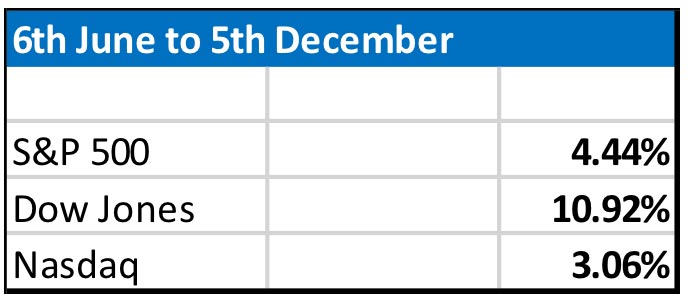
Putting returns into perspective, all the gains this year were made in the first half of the year, not the second:

In times of insecurity take the dividend income and Mark Barnett says exactly the same thing - he runs £16bn for Invesco Perpetual, including the Perpetual Income and Growth Trust that many of our clients hold. You can watch a clip of him discussing this here: www.goo.gl/U4S5FB
He took over the income funds from Neil Woodford and has delivered 8.18% per year for the last ten years, outperforming the FTSE All Share by 40% each year (8.18% versus 5.85%)
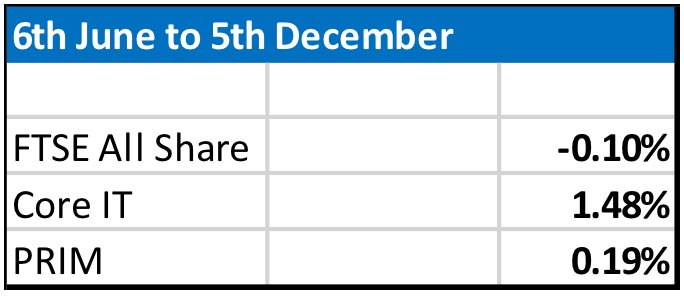
Core IT is our investment trust portfolio, PRIM is our cautious to balanced staple which is targeted to produce 70% of the upside of the FTSE and only 50% of the downside. You can see that this year it is just about spot on (5.48%/7.87%), and that is without any derivatives, algorithms, calls, options or anything complex. Where the proof is concerned, PRIM is a good pudding.
The headlines are from the US, not the UK
The figures I’ve shown show the run up quite clearly – don’t be concerned about the use of the term ‘record highs’ because if you think about it, if we have growing GDP and a little bit of inflation then the market will gradually rise which means ‘record highs’ is a pointless observation, it should happen every year, shouldn’t it?. Doesn’t that just show us the market is working?
And the flip side of that ‘working’ evidence is that the market will come down. If values are not rising and falling then something is broken.
Expect values to fall as well as rise – though if you don’t want that to happen to your portfolio it’s simple for us to solve, not a problem, that’s called cash.
Expect markets to be nervous – Trump and Brexit bring enormous uncertainty.
Expect retail cash interest rates to be next to nothing for a few years from here, and expect wage inflation to struggle to get anywhere.

So what does it mean, and what should we expect?
Until there’s somewhere else for the waves of money to go, and until the income yields from equities fall, the money will ebb and flow from the stockmarkets.
Whilst equities yield 3-4%, and ten year bond yields are less than half that, and cash interest yields half of that again, then even in a big correction the cash will not stay away from equities for long. It’s how markets work.
The yield curve is flat – that means you get little extra interest for 10-15 years over what you (institutions) get for 2-3 years, so no one bothers with long dated fixed income. That means cash is kept close to hand, very liquid and useable, to take advantage of any correction seen.
Consider this: India's population will increase 15m in the next year and its median age is 27; South East Asia will increase 8m and its median age is 28. If the UK market were to fall, say 25%, next spring do you think Unilever and Proctor & Gamble will sell more baby products or less in those two regions? Does the value of GE's shares have any relevance to the cashflows being generated by the new demographics?
Measured back over 12, 20 and 30 years the FTSE has delivered between 2.2% and 5% per year – that’s not runaway growth. It seems many commentators are being ‘fooled’ by statistics that show index growth from the depths of the correction in 2008-09 which is the steep red line below. It has grown at 9.2%pa, but only because it was down 40% the previous year. Go back twenty years and the annual growth rate flattens to 5.9% - what period is relevant to you as an investor? Pick-your-own-growth figure:

Lastly, before anyone rushes to sell GE stock because of its debt pile, the other relevant bit of information is that although the current $134bn is big, it was actually $550bn in 2009 so it has paid back $416bn in debt in the last eight years – perhaps that is how it has lasted in the Dow for so long, while others come and go?
Over the next year the markets will fluctuate – we can guarantee it, and irrespective of the market being up or down we’ll still buy our soap, cheese, petrol, electricity, phones, shoes, vegetables, beer, paint, flights, coffee, inks, biscuits, books, towels, detergents, cat food…..