
What are revenue reserves? Why are they held?
Essentially, an income paying investment trust collects and aggregates income from the companies in which it invests. They then pay out this income to its own shareholders as its own dividends. To streamline this process, it uses an internal ‘revenue reserve’.
An investment trust is legally required to pay out a minimum of 85% of the income it receives during the financial year. These are usually distributed to shareholders via dividend (cash) payments.
The remaining 15% of the earnings can be retained by the company in their revenue reserve account to support the payout in future years.
Should the trust suffer a bad year and the total revenue does not support the intended dividend, the company can dip into the revenue reserve to supplement the dividend and maintain the dividend level/increase.
The revenue reserve plays a key role in maintaining the regular flow of dividend payments and given their long trading history, some ITs have been able to build up substantial reserves over the years.
Revenue Reserves
Over the past 10 years we saw a dramatic market fall followed by a strong bull market, however, the value of the revenue reserves for most investment trusts over this period have been relatively stable, but not in all cases.
Alliance Trust IT increased their reserve by £53.5M from £58.3M in 2006 to £111.8M in 2017. Conversely, Scottish Mortgage IT used £40M of revenue reserves to maintain their dividend, reducing the reserve from £68.8M to £28.8M over the same period.
The average value of the revenue reserves across the IT sector increased from £40.1M to £48.5M which is a 21% increase (1.92% annualized) over the same period. Dividend Payments
The average increase in the value of the dividends across the IT sector increased from £15.1M or 12.7p per share to £24.9M or 22.8p per share which is a 64.6% increase (5.11% annualized) in the value of the dividends over the past 10 years. Reserve Cover
The average increase in the value of the reserve cover across the IT sector (Value & Income IT excluded) increased from 2.09 years to 2.31 years (which is a 10.5% increase) over the past 10 years.
The revenue reserve has not increased by the same amount as the dividend payments, even though the relative value of the reserves is more now than it was 10 years ago. This is because the average number of shares has also reduced by roughly 10%, from 200M to 180M.
This means that the ITs are still able to sustain the current level of dividend income should markets enter a prolonged downturn.
Dividend Payments
The average increase in the value of the dividends across the IT sector increased from £15.1M or 12.7p per share to £24.9M or 22.8p per share which is a 64.6% increase (5.11% annualized) in the value of the dividends over the past 10 years.
Reserve Cover
The average increase in the value of the reserve cover across the IT sector (Value & Income IT excluded) increased from 2.09 years to 2.31 years (which is a 10.5% increase) over the past 10 years.
The revenue reserve has not increased by the same amount as the dividend payments, even though the relative value of the reserves is more now than it was 10 years ago. This is because the average number of shares has also reduced by roughly 10%, from 200M to 180M.
This means that the ITs are still able to sustain the current level of dividend income should markets enter a prolonged downturn.
Methodology
All data was collected directly from the end of year financial accounts published on the Companies House website. From the accounts for the years 2007 to 2017, the following information was taken: Dividends: Value of dividends paid out in year (£s) Revenue Reserve: Value of retained revenue reserves (£s) Number of Shares: Weighted average number of ordinary shares (undiluted) - Preference shares excluded (only applies to City of London) All pricing data was collected from Financial Express Analytics as at 31/12/20xx. All Inflation data is based on RPI with data collected from the Office for National Statistics (ONS).
Investment Trusts Included in Analysis
Alliance Trust
Lowland
Bankers
Majedie
British Empire
Merchants
Brunner
Mid Wynd International
Caledonia
Monks
City of London
Murray Income
Dunedin Income Growth
Murray International
Edinburgh Investment
Perpetual Income & Growth
F&C Global Smaller Companies
Scottish American
F&C Investment Trust
Scottish Investment Trust
Finsbury Growth & Income
Scottish Mortgage
Hansa Trust
Shires Income
JPMorgan Claverhouse
Temple Bar
JPMorgan Global Growth & Income
Value and Income
Law Debenture Corporation
Witan
Calculations
The calculations used during this project are described below; examples given are based on Murray International for 2017.

Reserve Cover Calculation

Dividends per Share
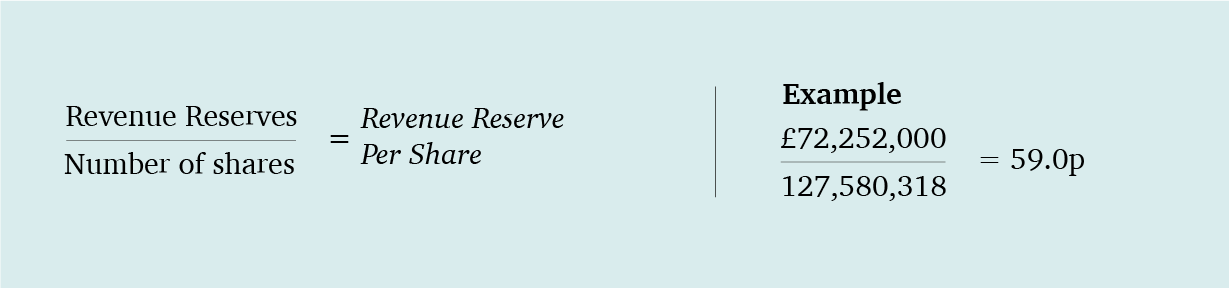
Revenue Reserve per Share
The above calculations were completed for each year from 2006 to 2017 for each IT and the results were tabulated.